KEY POINTS
- There are totally 33 economic cycles in the US. They have lasted less than 5 years on average. If we only count the recent 11 cycles, the average duration of each cycle increases to 6 years
- We found that economic cycles can last as long as 8 years or above and as short as 3 years or below but both cases are rare
- We found several common causes of double-dip recessions in the past namely 1) premature tightening policy, 2) high inflation, 3) deflation and 4) non-economic factors
- We have not seen the above signs of a double-dip recession in the US currently while some of these problems have already occurred in Europe
Bad news has been kept coming wave after wave and we have weathered one after another potential crisis since June this year. On 29 June, Greece parliament narrowly approved a five-year austerity plan and successfully gained the fifth loan payment of 12 billion euro from the 110 billion-euro bailout plan. On 1 August, the gridlocked Congress finally reached a consensus on extending the country’s debt ceiling and a 2.1 trillion deficit reduction plan, to avoid a catastrophic default.
However, the sovereign debt crisis in Europe and in the US hasn’t improved. Worse still, global equity markets tumbled as investors were speculating about a double-dip recession. The New York Times, a conservative newspaper, even claimed that US economy is poised to enter into a recession again. Is it true? In this article, we look at the past experience and present some observations on a double-dip recession. We also discuss whether the US economy will shrink further.
WHAT WE HAVE LEARNT FROM THE DOUBLE-DIP RECESSIONS IN THE PAST
For those who do not believe a double-dip recession is likely to happen, their general view is that economic recession is the lower turning point (trough) of a business cycle. It usually occurs after a long period of economic expansion which results in excess demand (aggregate demand exceeds long-run aggregate supply). Such pre-conditions do not exist in most countries today, following the 2008 crisis. On the other hand, some may argue that we are paying the price for the Fed’s lowering of interest rates over the past 30 years. The rate cut is to prevent a recession, but it also builds a new bubble. The current virtually zero interest level means we lack tools to protect us from the negative economy shocks.
| Table 1: Long (Above 8 years) and Short (Below 3 years) Economic Cycles over the Past Century | |||
| Economic Cycle Reference Date | Cycle Duration In Months | ||
| Peak | Trough | Trough from Previous Trough | Peak from Previous Peak |
| January 1913 | December 1914 | 35 | 36 |
| January 1920 | July 1921 | 28 | 17 |
| May 1923 | July 1924 | 36 | 40 |
| February 1945 | October 1945 | 88 | 93 |
| April 1960 | February 1961 | 34 | 32 |
| July 1981 | November 1982 | 28 | 18 |
| July 1990 | March 1991 | 100 | 128 |
| March 2001 | November 2001 | 128 | 128 |
| Average Duration In Month | |||
| 1854-2009 (33 cycles) | 56 | 55 | |
| 1945-2009 (11 cycles) | 73 | 66 | |
| Source: NBER | |||
The former argument is correct if we only look at economic data over the past 20 years. However, it is conceptually wrong in a macroeconomics perspective. In fact, every economic cycle is unique as they can occur in different pattern. According to the National Bureau of Economic Research, from 1850s onwards, there are totally 33 economic cycles in US. It lasted less than 5 years on average. If we only count the recent 11 cycles, the cycle duration increases to 6 years. We found that economic cycle can last as long as 8 years or above and as short as 3 years or below, but both cases are rare. Over the past century, US experienced four short economic cycles. It proved that recession can happen after a short-lived economic recovery. Short economic cycles have also happened in other countries like Germany, Japan, China and Hong Kong in the past. Some of these economies even dipped more than twice – we call it a multiple-dip recession.
The latter argument cannot explain the reasons of the emergence of a double-dip recession. We look at the historical data and found several common causes of the past double-dip recessions namely 1) premature tightening policy, 2) high inflation, 3) deflation and 4) non-economic factors.
SIGNS OF THE PAST DOUBLE-DIP RECESSIONS
1. Premature Tightening Policy
Premature tightening policy is an important risk factor in the past double-dip recessions especially in US and Japan.
Chart 1: Multiple-Dip Recession In Japan
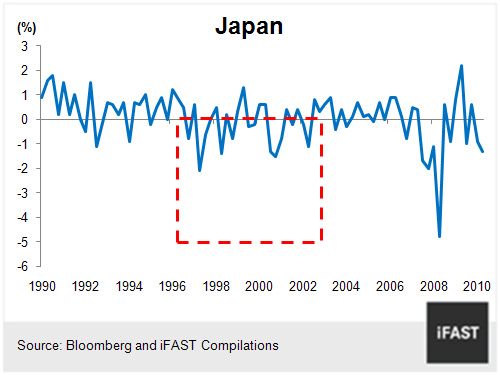
A huge lesson can be learnt from Japan in 1990s and 2000s during which the Japanese asset bubble burst in 1990, the private sector’s balance sheets were damaged seriously. The first priority of companies and households was to minimise debts instead to maximise profits. Still, Japan’s GDP managed to keep growing almost every year until 1998, thanks to the government’s massive fiscal stimulus. In 1997, the Hashimoto administration announced the country’s first fiscal reform programme in the post-bubble era to reduce the fiscal deficit by 15 trillion yen via raising consumption tax from 3% to 5%, cancelling special income tax and drastically scaling back the government’s expenditure. The economy then proceeded to shrink for five straight quarters amidst the credit crunch, the country’s worst post-war meltdown (see Chart 1). In order to control the fiscal deficit and the debt level, Japanese government withdrew the stimulus when there were signs of recovery, and the economy sank again because the private sector was still deleveraging.
Chart 2: Multiple-Dip recession in US
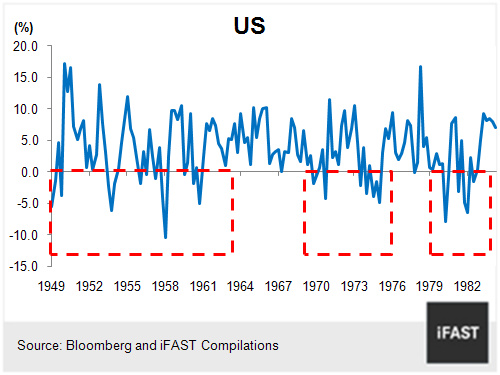
US, on the other hand, should not find the 1930s Great Depression unfamiliar. In an article titled "The Lessons of 1937", Christina Romer, the former chairwoman of Barack Obama’s Council of Economic Advisers and a scholar of the Depression, addresses the risk of a "W-shaped" recession if the tightening policies are rolled out when the recovery remains fragile. The US economy re-entered the recession in 1937 and 1938 and the unemployment rate perked up to 19% when the Federal Reserve doubled reserve requirements. Consequently, banks reduced lending and the economy contracted.
Another example was seen in 1980 when the US economy was hit by high inflation after the 1979 energy crisis. The US government believed inflation was high at that time and introduced measures to control credit expansion. The measures pushed up the borrowing costs for banks, resulting a short recession which ended in July 1980. Thereafter, US experienced a jobless recovery as unemployment rate was stubbornly high. In order to solve the inflation problem when the economy started to pick up, the Fed Chairman Paul Volcker raised interest rate drastically to 20% by June 1981. High interest rate caused the collapse of the real estate market and ultimately led to a double-dip recession (see Chart 2).
2. High Inflation
It is widely believed that causes of high inflation include the supply shock of essential commodities (e.g crude oil) and excessive expansion of money supply. Both factors lead to a drastic increase in labour cost and the price level. Also, unemployment rate will increase as wage increases above productivity. A high rate of inflation and unemployment are precursors of a double-dip recession.
High inflation which led to a recession occurred in 1970s and 1980s respectively in US (see Chart 2). In 1973, the Organisation of Petroleum Exporting Countries (OPEC) cartel proclaimed an oil embargo until March 1974 and quadrupled the crude oil price. Another macro backdrop is that the US unilaterally pulled out of the Bretton Woods Accord and took US off the established Gold Exchange Standard in August 1971, allowing the US dollar to float. Shorty, the industrialised nations followed the floating regime and central banks increased their reserves by printing money for the purpose of "managed floating" (intervention in the foreign exchange market). As a result, the US dollar depreciated and the oil price increased. American household soon found that the price of gasoline surged sharply while companies faced higher production costs, hence it triggered an economic contraction.
The second bout of high inflation period in early 1980s was discussed above. It resulted in inappropriate monetary policies and thereby led to a double-dip recession (see Chart 2).
3. Deflationary Spiral
The resultant lower wages lead to lower demand, which in turn cause further decreases in price.
Among all countries in the world, Japan has the longest history of deflation since the World War II. Deflation has persisted and deeply entrenched in Japan over a decade since 1998. One of the key factors is that the sharp deterioration of corporate and household balance sheets after the asset bubble burst in the early 1990s has driven down the number of borrowers drastically. A company or household suffering from a debt burden is lack of willing to borrow to expand their consumption or business. With Japanese consumers and companies are reluctant to spend and invest, the aggregate demand in economy shrank and thereby put further downward pressure on the price level.
Chart 3: Multiple-Dip Recession in Hong Kong
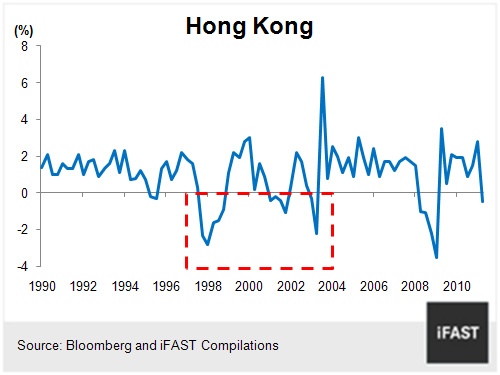
Hong Kong also went into a multiple-dip recession during 1998 to 2003 (as shown in Chart 3). After experiencing a prolonged period of economic expansion and excesses, Hong Kong property and stock market collapsed amidst the Asian financial crisis of 1997-1998. Hong Kong recorded a negative GDP growth for five consecutive quarters during the period, one of the worst recessions in history. The city also registered negative GDP growth for four straight quarters after the tech bubble burst in 2001. The city experienced a long period of deflation after the property and stock market bubble burst as deterioration of corporate and household balance sheets affected their willingness to spend and invest. Composite CPI turned negative in year-on-year growth for the 68 consecutive months, from November 1998 until April 2004!
4. Non-economic Factors
We have found some non-economic factors in the past double-dip recessions. Examples include German unification and SARS.
Chart 4: Multiple-dip Recessions in Germany
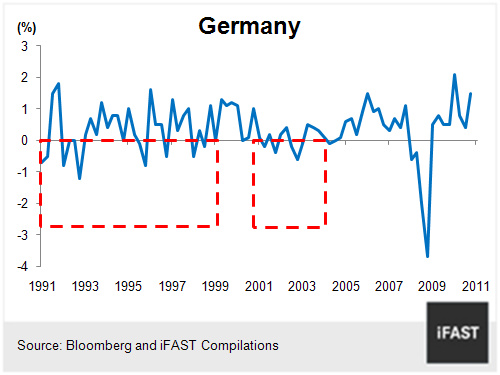
Germany’s economy tumbled precipitously after the reunion of the two Germanys in October 1990 and experienced a multiple-dip recession throughout the 1990s and the early-2000s (see Chart 4). After the unification, the pan Germany’s GDP was dragged down by East Germany which went into a deep recession. The 1:1 conversion rates of East German marks (Ostmark) into Deutsche marks resulted in wages far exceed the productivity level in Eastern region. East German wages increased sharply despite unemployment rate mounted. Industrial output of East Germany plunged more than two thirds within one year as many factors became obsolete under the excessive labour cost. The government provided subsides into the Eastern region around 6% of the country’s GDP in the first five years after unification. The huge cost of unification plus the privatisation of state-owned business in the East lifted the fiscal burden for the German government and pushed the country into a prolonged recession.
We have mentioned that Hong Kong also went into a multiple-dip recession from 1998 to 2003, and the third dip occurred in 2003 when the deadly outbreak of SARS has dramatic effect on economic activities in Hong Kong.
NO SIGNS IN THE US
We do not see the aforementioned signs of a double-dip recession in the US currently.
No Deflationary Pressure
Chart 5: Compositions of CPI in US
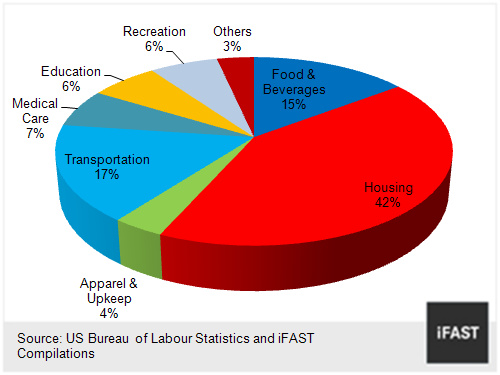
Chart 6: CPI less food and energy and shelter
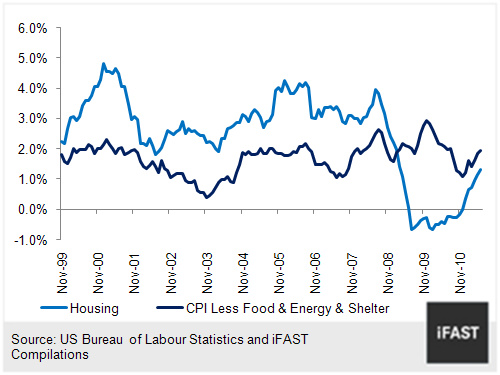
Firstly, in contrast to last year’s slowdown, we do not see a strong deflationary pressure in US currently. Excluding volatile food and energy price, core CPI grew 1.6% year-on-year in June 2011. This is above 1% threshold for the fifth consecutive month while core CPI was below 1% for the ninth consecutive month since April last year. More importantly, we are seeing a broad-based inflation – all prices of services and goods of the economy except housing prices. Housing is the dominant component in US CPI for all Urban Consumers which weights 42% of the total basket value (Chart 5). It fell into negative territory since July 2009, obscuring the uptrend of other CPI components. In fact, CPI less food and energy and shelter has been steadily hovering at an acceptable range between 1% and 2% since the economy recovers (Chart 6). It shows the inflationary risk is greater than the deflationary risk in US at least at the current moment.
A 1970s- or 1980s-styled High Inflation Will Not Happen
Chart 7: Record High Excess Reserves
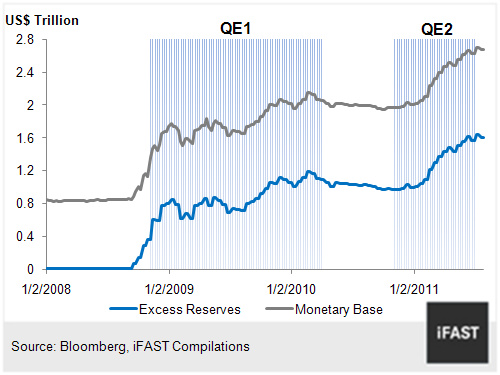
We do not believe a 1970s- or 1980s-style high inflation to happen. Some investors worry excessive liquidity in the global economy will drive up the commodity prices and thereby create the high inflation environment. However, with the record high US$ 1.8 trillion excess reserves (Chart 7), we wonder how the liquidity created by the FED alone could push up commodity prices. In fact, the difference between the increase in printed money since QE1 and the increase in excess reserves is small. Speculation could be another major force of commodity rally but high commodity prices driven up by speculation usually do not last long. Example includes oil price rising from US$ 88 per barrel to a peak level of US$ 145 per barrel in 2008. Recently, international oil price came down to below US$ 90 per barrel. In June 2011, US, major industrialised countries and International Energy Agency unleashed oil reserves to tame the climbing oil price. It shows the ambition of governments to act against the high oil price. CRB Index which represents commodity prices also plunged more than 10% from its peak in April this year. Stripping out the political events which are hardly predicted, we can’t see a 1970s- or 1980s-style high inflation environment around the corner in near term.
Chart 8: Money Multiplier Has Collapsed
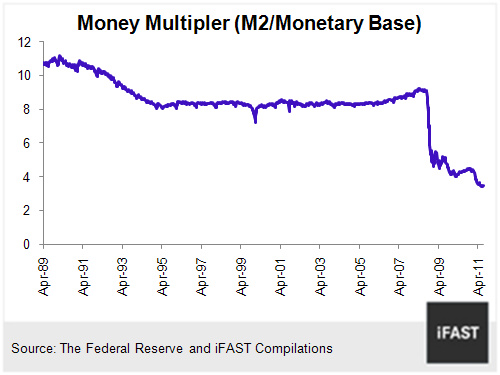
There is an argument that hyperinflation will be caused by the ultra low interest rate and excess liquidity. However, as long as the velocity of money drops, the increase in money supply may not result in hyperinflation. The money multiplier has collapsed as shown in Chart 8. As a rule of thumb, the greater the money multiplier, the higher the money circulation would be. It shows that the increase in monetary base (printed money) has been held in banks’ reserves instead of circulating in the banking system. Under this situation, the loosening monetary policy would not result in a high inflation environment.
No Way to Tighten Policy in the Near Term
There is no way that the Fed is going to begin the tightening policy in anytime soon. The Fed Chairman Ben Bernanke pledged to keep interest rate at exceptionally low level for two more years. Markets widely expect Bernanke to announce QE3 or other forms of monetary easing in the Fed conference on 26 August. US President Obama also unveiled that he is proposing a fresh economic stimulus to revive the faltering recovery, though the amount will not be huge as the two parties just reached a compromise on the debt ceiling impasse.
EVIDENCE OF RECESSION EMERGES IN EUROPE
On the other hand, European countries have already taken the aggressive austerity measures and ECB has even started its rate hike cycle. Apart from the debt-laden PIIGS countries, core Euro-zone countries have also prepared for the fiscal tightening policies. Sarkozy pledges drastic austerity measures to slash France’s budget deficit in order to keep the country’s AAA credit rating. The new austerity plan in Italy was approved in August while Spain’s austerity plan was approved in May this year. In addition, ECB has started its rate hike cycle in April this year and has raised rates twice to 1.5% thus far in order to tame the mounting inflation. As such, some evidence of recession has emerged in Europe.
OUR VIEW ON DOUBLE-DIP RECESSION
Premature tightening policy, high inflation, deflationary spiral and non-economic factors are some common causes of double-dip recessions in the past. It should be reminded that every recession could be triggered by some unique factors. These signs are not a must for a double-dip recession and they are only for readers’ reference. However, these signs are in line with our houseview on the economic outlook for US and Europe.
We believe Europe will enter into a recession. A set of economic indicators including PMI have already pointed to an economic downturn in the euro zone economies. European policy makers have taken aggressive austerity measures to reduce the fiscal deficit. However, fiscal tightening at a time when the economy and banks are yet to fully recover would dampen the economy further.
In an earlier article "US: What Is The Impact of Zero Percent Growth?", we have argued that the US GDP growth could fall short of the market expectation (2.5%), but it only means a slowdown instead of a full-blown recession. Consumption figures are disappointing in the first half of this year as it was depressed by the high oil and gasoline price. Investment component was also negatively affected by the Japan’s earthquake which resulted in supply chain disruptions. Energy prices have declined since the second half and the supply chain restoration has been improved. Thus, the GDP growth is expected to rebound in the second half.
One of the key concerns is the spillover effect of the European debt crisis to US economy. Recent market turmoil is another near-term risk as it may somewhat affect the business’ and consumer’s already-weak confidence. However, given that corporate and household has continued to deleverage after the 2008 financial crisis, we don’t expect a serious crisis to come.
We also conduct a stress test on US corporate earnings under some very conservative assumptions. The result is very positive - even if growth stalls in the second half of 2011 and revenue growth is muted in both 2012 and 2013, S&P 500 earnings can still be at all-time highs by end 2012. We advise investors to do the following things in a highly volatile market:
1. Stay calm and avoid panic
2. Focus on fundamentals – Valuation and Earnings
3. Prepare for buying opportunities
Related Articles