Keypoints:
- We filtered through the unit trusts on our platform and present our findings on the top performing EPF-approved Malaysia Equity unit trusts
- Based on returns and risk, the top performers were AMB Value Trust Fund, AMB Ethical Trust Fund, AMB Dividend Trust Fund, Kenanga Growth Fund and Kenanga Syariah Growth Fund
- The Hwang AIIMAN Growth Fund also deserves a mention as it has performed relatively well and is a Shariah-compliant unit trust
- Alternatively, investors that can stomach more risk can consider investing in the OSK-UOB Emerging Opportunity Unit Trust which invests into small to medium Malaysia companies
Over the past five years, the Employees Provident Fund (EPF) distributed an average of 5.55% dividends annually whereas the inflation rate averaged 2.59%. However, the EPF dividend rates have not always been higher than inflation. In 2008, the inflation rate was higher than EPF dividends; at 5.39% and 4.50% respectively (see Chart 1 below), meaning that your EPF savings shrunk 0.89% after adjusting for inflation. Essentially, inflation pushes up the cost of living and eats away the value of your EPF savings. Even EPF officials have consistently highlighted the need for contributors to supplement their retirement funds with other sources of income. As such, there is a dire need to seek high-quality investments.
| Chart 1: EPF Dividend Rate and Malaysia Annual Inflation Rate |
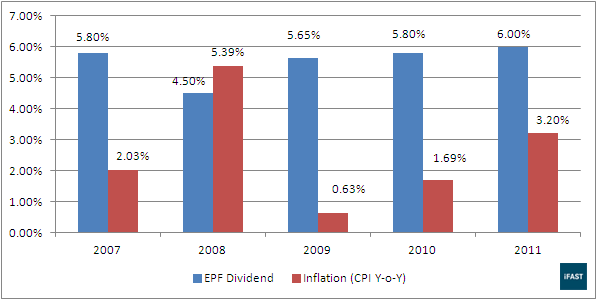 |
| Source: EPF, Department of Statistics Malaysia, iFAST compilations |
epf - lower yield, safe investment
As a national provident fund, the EPF’s primary investment objective is to seek a balance between profitability and prudence. Key considerations in investment decisions include the criteria of safety, stability, liquidity, and risk-adjusted returns. In order to meet its investment obligations, the EPF adheres to a disciplined investment procedure and guidelines laid out in the EPF Act 1991.
One such guideline is EPF’s strategic asset allocation as shown in Table 1.
 Table 1: EPF Strategic Asset Allocation |
||||||||
| Asset Class | Strategic Asset Allocation (%) | Variation (%) | ||||||
| Malaysian Government Securities (MGS) | 25 |
15 to 35 |
||||||
| Loans and Bonds | 25 |
15 to 35 |
||||||
| Equities | 20 |
10 to 30 |
||||||
| Money Market Instruments | 15 |
5 to 25 |
||||||
| Properties | 5 |
0 to 10 |
||||||
| International Investments | 10 |
0 to 20 |
||||||
| Source: EPF | ||||||||
We can see that EPF invests in a balanced portfolio, which means that its investments consist of a mix of equities and fixed income securities (such as Malaysian Government Securities, loans and bonds, and money market instruments). Looking at the fixed income securities portion, notice how wide the allowable variation is; anywhere from 35% to 90%. As of end 2011, EPF had about 64% invested in the fixed income securities (see Chart 2).
| Chart 2: EPF Asset Allocation As Of 31 December 2011 |
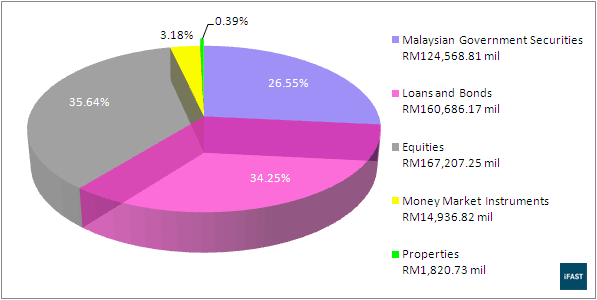 |
| Source: EPF Annual Report 2011 |
EPF is considered as a risk-free investment. Under the EPF Act 1991, EPF is required to pay a minimum interest payment of 2.5% a year to its members regardless of any economic conditions. That aside, EPF members who are willing to trade off safety and protection for potentially higher returns can consider investing into other investments such as EPF-approved unit trusts.
return Comparison of EPF-Approved Malaysia equity unit trusts on our platform
According to the Securities Commission Malaysia, there are over 590 unit trusts from 40 fund houses in Malaysia (as of the date of writing), so choosing the right unit trust to invest in can be a headache.
Table 2 shows the calendar year and annualised returns of 10 EPF-approved Malaysia equity unit trusts available on our platform, along with the returns of a comparable broad-based index – the FTSE Bursa Malaysia Kuala Lumpur Composite Index (FBM KLCI). The FBM KLCI may not be the actual benchmark used by the respective unit trusts, but it gives a rough idea on whether a unit trust is able to outperform the Malaysian stock market as a whole. We have also opted to use the total return index (i.e., including dividends reinvested), which we believe is a fairer yardstick than the simpler price index (i.e., excluding dividends paid out by companies). Outperformance of unit trusts relative to the FBM KLCI is highlighted in red and the table is sorted according to annualised returns.
Table 2: EPF-Approved Malaysia Equity Unit Trust Returns |
||||||||
| Unit Trust/Index | Returns (%) |
|||||||
2007 |
2008 |
2009 |
2010 |
2011 |
2012* |
Annualised** |
||
| AMB Value Trust Fund | 55.8 |
-16.0 |
38.4 |
25.1 |
2.7 |
9.8 |
18.3 |
|
| Kenanga Growth Fund | 38.1 |
-24.7 |
33.3 |
32.7 |
19.1 |
8.8 |
16.8 |
|
| AMB Ethical Trust Fund | 49.6 |
-16.2 |
36.9 |
22.3 |
-0.1 |
12.2 |
16.5 |
|
| OSK-UOB Emerging Opportunity Unit Trust | 76.5 |
-32.0 |
23.6 |
19.3 |
5.2 |
23.9 |
16.2 |
|
| Kenanga Syariah Growth Fund | 40.8 |
-26.0 |
30.4 |
29.7 |
16.9 |
8.2 |
15.4 |
|
| AMB Dividend Trust Fund | 25.7 |
-14.9 |
38.7 |
18.9 |
7.5 |
15.5 |
15.1 |
|
| OSK-UOB Smart Treasure Fund | 66.0 |
-33.1 |
32.8 |
23.5 |
3.1 |
10.3 |
13.9 |
|
| Hwang AIIMAN Growth Fund | 28.8 |
-25.9 |
44.0 |
20.8 |
4.7 |
13.1 |
12.9 |
|
| Eastspring Investments Dana Al-Ilham | 46.0 |
-36.9 |
42.1 |
21.3 |
9.0 |
11.3 |
12.5 |
|
| FBM KLCI | 37.8 |
-36.2 |
50.0 |
23.8 |
4.5 |
8.6 |
11.7 |
|
| AmIslamic Growth | 38.9 |
-34.3 |
30.5 |
19.3 |
6.0 |
9.1 |
9.3 |
|
| *Year-to-date as of 31 July 2012 **From 31 December 2006 till 31 July 2012 Source: iFAST compilations |
||||||||
Looking at the annualised returns in Table 2, there are 9 EPF-approved Malaysia equity unit trusts that outperformed the FBM KLCI’s 11.7% returns per annum, achieving outperformances of 0.8 - 6.6% percentage points per annum. If we take a closer look at the calendar year returns of 2007 to 2011, there were 4 very strong performers, namely the AMB Value Trust Fund, Kenanga Growth Fund, OSK-UOB Emerging Opportunity Unit Trust, and Kenanga Syariah Growth Fund. These unit trusts have all outperformed the FBM KLCI in at least 3 out of the past 5 calendar years and also outperformed the FBM KLCI on an annualised basis.
All 10 unit trusts mentioned in Table 2 invest in Malaysia equities with some also investing a small portion in bonds or foreign equities. The AMB Value Trust Fund and the AMB Ethical Trust Fund invests in bonds, with 5% and 3% allocations respectively (as at 30 June 2012). The OSK-UOB Emerging Opportunity Unit Trust, which invests into small to medium Malaysia companies, has investment exposure to Thailand and Indonesia equities too, at 10.5% and 2.8% of total net asset value (NAV) respectively (as at 31 July 2012). Also, the AMB Dividend Trust Fund has a 7.8% allocation in foreign quoted equity and 11.0% in foreign REITs (as at 30 June 2012).
Another thing to take note is that all three AMB equity unit trusts shown in Table 2 are externally managed; AMB Ethical Trust Fund and AMB Value Trust Fund are externally managed by UOB-OSK Asset Management Sdn Bhd while the AMB Dividend Trust Fund is externally managed by Hwang Investment Management Berhad.
Higher Returns, But At Higher Risk?
After taking a look at the performance of the 10 EPF-approved Malaysia equity unit trusts above, we now examine their riskiness to identify unit trusts that have relatively lower risk yet recorded relatively higher returns. Table 3 shows the volatility, Sharpe ratio and downside risk of these unit trusts. The table is sorted according to downside risks and outperformance relative to the FBM KLCI is highlighted in red.
Table 3: EPF-Approved Malaysia Equity Unit Trust Risk-Adjusted Returns |
||||
| Unit Trust | Annualised* |
|||
Volatility (%) |
Sharpe Ratio |
Downside Risk (%) |
||
| AMB Dividend Trust Fund | 9.7 |
1.23 |
6.5 |
|
| Kenanga Syariah Growth Fund | 11.5 |
1.07 |
7.7 |
|
| Kenanga Growth Fund | 11.6 |
1.17 |
8.2 |
|
| AMB Value Trust Fund | 13.5 |
1.12 |
8.3 |
|
| AMB Ethical Trust Fund | 13.5 |
0.99 |
8.3 |
|
| Hwang AIIMAN Growth Fund | 13.5 |
0.72 |
9.3 |
|
| OSK-UOB Smart Treasure Fund | 16.4 |
0.66 |
11.0 |
|
| AmIslamic Growth | 14.0 |
0.44 |
11.3 |
|
| FBM KLCI | 15.3 |
0.56 |
12.2 |
|
| OSK-UOB Emerging Opportunity Unit Trust | 19.0 |
0.68 |
12.2 |
|
| Eastspring Investments Dana Al-Ilham | 15.8 |
0.59 |
13.6 |
|
| *From 31 December 2006 till 31 July 2012 Source: iFAST compilations |
||||
Before examining the riskiness of these unit trusts, let's understand these 3 different risk indicators. Volatility, or standard deviation, is a measure of how much the return of an asset, in this case unit trust, fluctuates over a certain period. The higher the volatility, the wider the fluctuation or variation of the returns.
On the other hand, the Sharpe ratio indicates the excess return an investor is expected to receive for every unit of risk that the unit trust undertakes. The excess return is calculated by subtracting the risk-free rate from the return of the investment and then divided by the volatility of the unit trust. In Table 3, we have used the Maybank’s 12-month Fixed Deposit rate of 3.15% as the risk-free rate. In general, the higher a unit trust’s Sharpe ratio, the higher the excess return an investor is expected to receive for a unit of risk.
The downside risk is an indicator of the potential losses a unit trust will suffer when markets are bad. A low downside risk indicates that a unit trust’s losses (if any) tend to be very consistent, whereas a high downside risk indicates that the losses (if any) could be anywhere in between mild and extreme. In mathematical terms, downside risk is simply the annualised standard deviation of all negative monthly excess returns (i.e., after deducting the risk-free rate).
From Table 3, both the AMB Dividend Trust Fund and OSK-UOB Emerging Opportunity Unit Trust which have exposure to foreign markets recorded contrasting risk performance. The AMB Dividend Trust Fund emerged top with the lowest downside risk while the OSK-UOB Emerging Opportunity Unit Trust recorded the second highest downside risk. Following AMB Dividend Trust Fund are the Kenanga Syariah Growth Fund, Kenanga Growth Fund, AMB Value Trust Fund and AMB Ethical Trust Fund which recorded relatively strong risk performance.
Conclusion
After testing out these 10 EPF-approved Malaysia equity unit trusts in terms of their return and risk performances for the past 67 months as at end July 2012, there are 7 unit trusts (some of which are Fundsupermart.com’s Recommended Unit Trusts) that deserve investors’ attention.
AMB Value Trust Fund, AMB Ethical Trust Fund, AMB Dividend Trust Fund, Kenanga Growth Fund and Kenanga Syariah Growth Fund stood out as clear outperformers, putting in a solid performance at a lower risk compared to its peers and the benchmark FBM KLCI. The fund managers of these unit trusts were skilled in bringing in returns while keeping the risk down to a minimum.
Among these unit trusts, investors with a low risk appetite may consider the AMB Dividend Trust Fund which recorded the lowest downside risk (even lower than balanced unit trusts) yet still managed to deliver good returns.
An additional highlight would be the Hwang AIIMAN Growth Fund which has performed relatively well and is a Shariah-compliant unit trust.
Also worth mentioning is the OSK-UOB Emerging Opportunity Unit Trust which invests into small to medium Malaysia companies and hence, is riskier as seen in its relatively high volatility. However, if you can stomach the risk and fancy small caps, then this unit trust should be considered. As of 31 July 2012, its 23.9% year-to-date return is by far the highest return among the rest.
If investors would like to invest in EPF-approved Malaysia equity unit trusts, investing in any of these 7 top performing unit trusts would be a good choice, subject to an investor’s personal financial situation and risk appetite.
Alternatively, if investors would prefer to invest in EPF-approved balanced unit trusts which are generally less risky, please see our other article, Here's Our Top EPF-Approved Balanced Unit Trusts.
Got a comment? An opinion? Maybe an idea? Tell us! Drop us an email.
Related Articles
Here's Our Top EPF-Approved Balanced Unit Trusts
Why Investing With Your EPF Monies May Help Boost Your Retirement Fund
How to Invest in Unit Trusts with EPF Savings